

Training Runs
Train
Monitor a Training Run
Track training progress with real-time graphs, eval scores, and GPU logs.
Once a training job starts, the training details page gives you real-time visibility into what's happening. A progress bar shows percentage complete and the current status of the run.
Training graphs
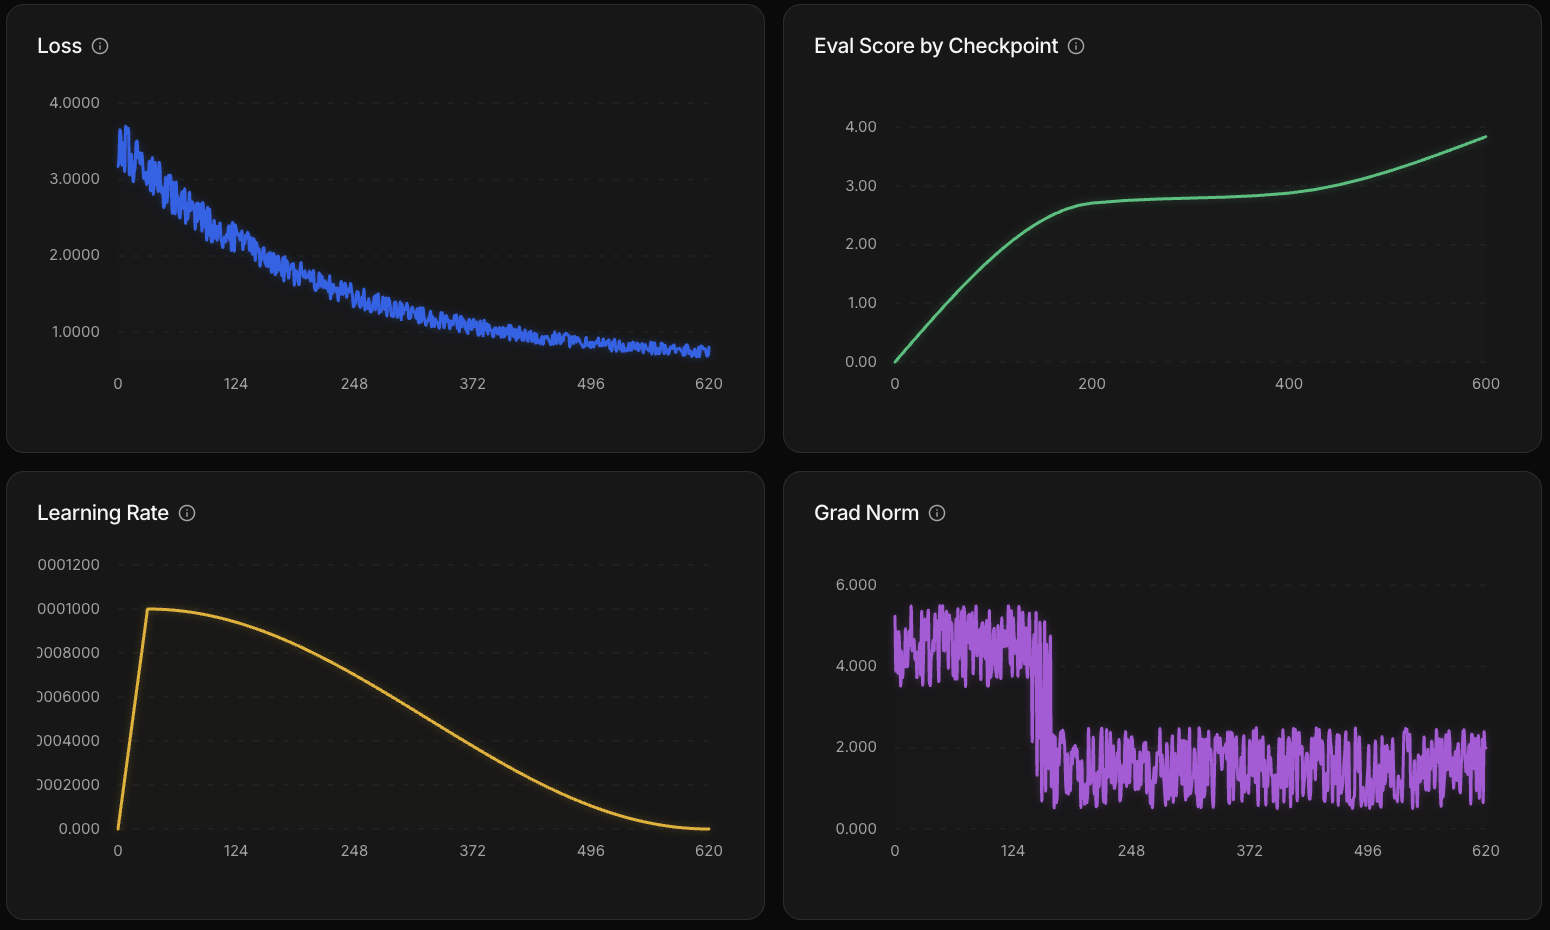
Four graphs update as training progresses:
| Graph | What it measures | What to look for |
|---|---|---|
| Loss | How far the model's predictions are from expected output | Decreasing = learning. Flattening = model has learned what it can from the data. |
| Learning rate | How much weights update at each training step | Warm-up then decay schedule — configured by the recipe automatically. |
| Gradient norm | Gradient magnitude during backpropagation | Steady or decreasing = stable. Persistent spikes may indicate a data quality issue. |
| Eval score | Average score on the eval dataset at each checkpoint | Trending up = model is improving at your task. This is the most direct signal that training is working. |
Evaluations
The platform runs evaluations at three points during a training job:
- Before training — establishes a baseline score for the model before any weight updates
- During training — at each checkpoint, the model runs your eval dataset and an LLM judge scores the outputs against built-in quality and similarity rubrics
- After training — a final evaluation on the completed model
Checkpoints
Training saves checkpoints at regular intervals. If a run fails after a checkpoint, it can be resumed from the last saved state rather than starting over.
Logs
The Logs tab shows output from all GPUs during training. Use it to debug issues or see what's happening under the hood. You can filter logs by type — warn, error, and others — to focus on what matters.