

Gateway
Inference Viewer
Browse, filter, and inspect individual LLM requests and responses.
The Inference Viewer is a filterable table of every LLM call that flows through the Inference platform. Use it to inspect individual requests, debug issues, and find samples to save as datasets for evals and training.
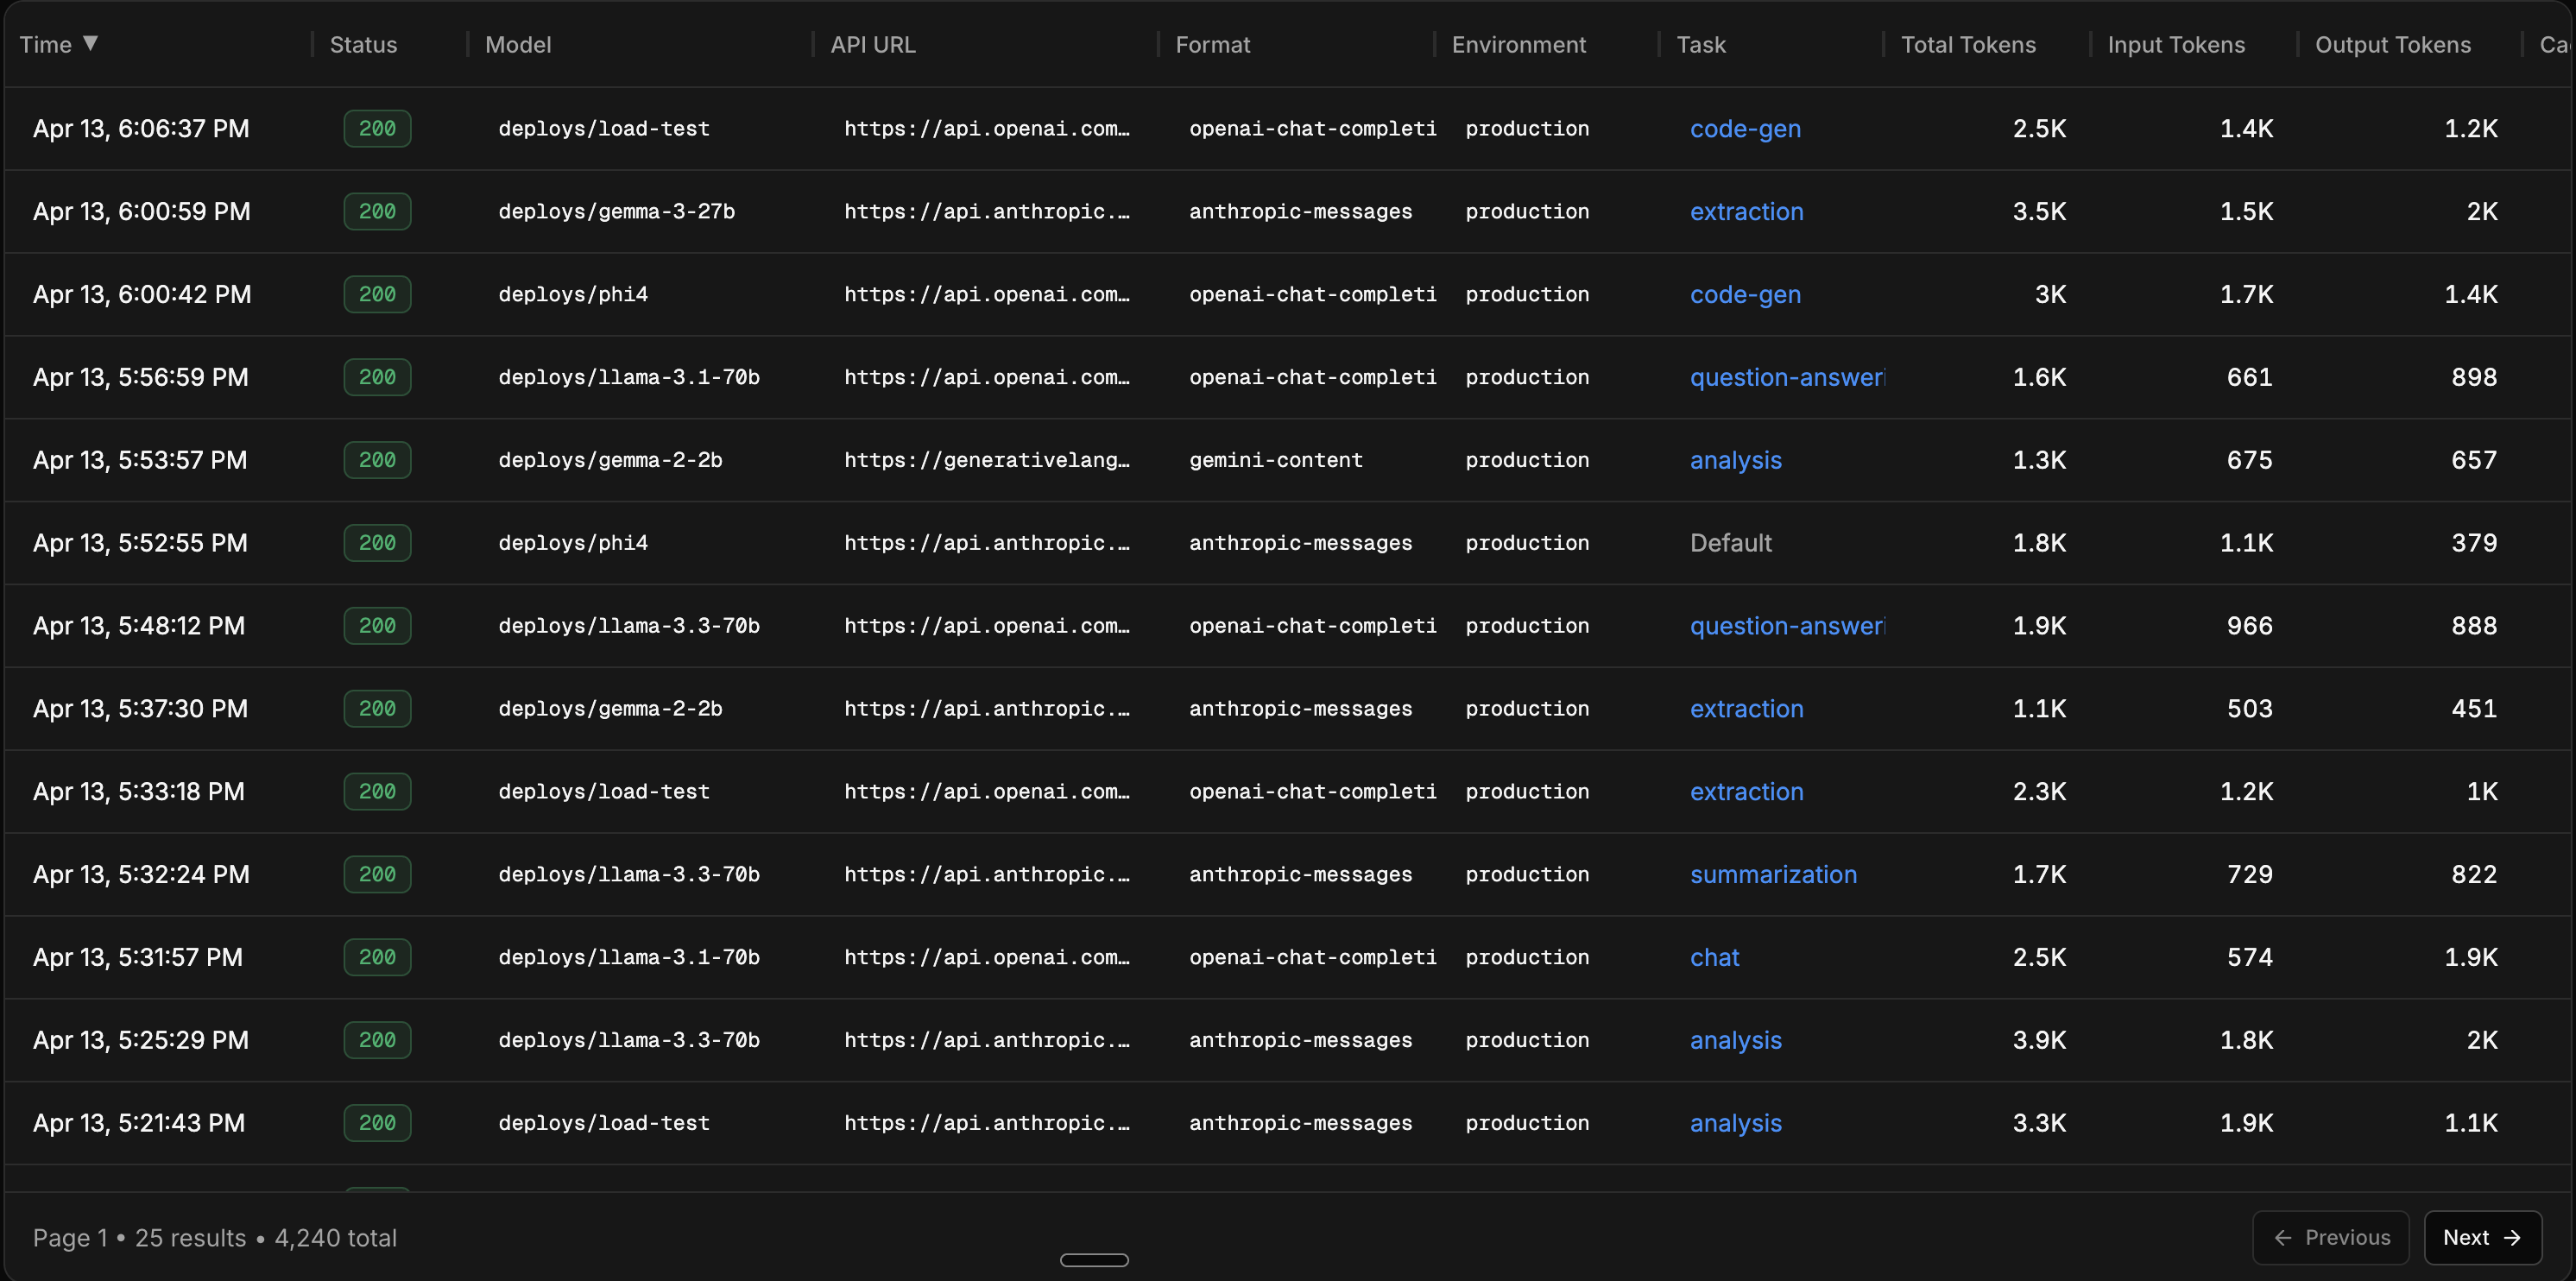
Table columns
Each row in the table represents a single LLM call. The visible columns are configurable, and include:
| Column | Description |
|---|---|
| Time | When the request was sent |
| Status | HTTP status code |
| Model | The model used |
| API URL | The endpoint you called — e.g. https://api.inference.net/v1/chat/completions for requests Inference serves. For pass-through requests that use your own provider key or x-inference-provider* headers, the upstream URL you chose. |
| Environment | Environment tag (production, staging, etc.) |
| Task | The task ID, if one was set |
| Input / Output / Total Tokens | Token counts for the request and response |
| Cached Tokens | Tokens served from cache |
| Reasoning Tokens | Tokens used for reasoning (where applicable) |
| Cost | Total cost, with input and output cost breakdown |
| Duration | End-to-end request latency |
| TTFT | Time to first token (for streaming requests) |
| Request / Response Size | Payload sizes in bytes |
You can sort by time, status, cost, duration, tokens, or payload size.
Filtering
The filter builder lets you combine multiple conditions to narrow down your traffic. Filters are available for both categorical and numeric fields.
Categorical filters:
- Model - filter to specific models
- Provider - filter by upstream provider
- Task - filter by task ID
- Environment - filter by environment tag
- Status - filter by HTTP status code or range (success, error, 2xx, 4xx, 5xx, or specific codes like 429)
- Streaming - filter streaming vs non-streaming requests
Numeric filters:
- Duration - filter by latency (e.g. requests slower than 5s)
- Cost - filter by cost (e.g. requests costing more than $0.05)
- Input / Output Tokens - filter by token count (e.g. input > 5k tokens)
- Request / Response Size - filter by payload size in bytes
Quick filters are available for common queries: input tokens > 5k, cost > $0.05, duration > 5s, and status = error.
Detail view
Click on any row to open the detail panel. This shows the full picture of a single inference:
- Full request and response payloads (viewable as raw JSON)
- Cost breakdown (input, output, reasoning, cached)
- Token breakdown (input, output, reasoning, cached) with visual bars
- Duration and time to first token
- Model, provider, task, and environment
- Streaming status
- Request metadata (key-value pairs)
- Geolocation (country, city)
Save as dataset
You can build datasets from live traffic directly in the Inference Viewer or from the Datasets tab. Apply filters to get a representative slice of your data, then click Save as Dataset to create an eval or training dataset from the filtered results.
The dataset creation flow:
- Apply your filters to narrow down the traffic
- Review the matching inferences
- Optionally set a limit on how many inferences to include
- Choose whether this is an eval dataset or a training dataset
- Name the dataset and save
The saved dataset is immediately available for training a model.
Use task tags to filter by objective before saving a dataset. This gives you clean, focused samples instead of a mix of unrelated traffic.
Next steps
Build a dataset from traffic
Step-by-step guide for turning filtered traffic into datasets.
Compare models with AutoEvals
Replay your traffic against candidate models and get a recommended winner.
Upload a dataset
Already have data? Upload a JSONL file directly.
Organize with tasks
Group calls by objective for better filtering and per-feature metrics.